Interactive Map Samples Showcase
Google Maps
created by GMap Editor or from custom map solution.
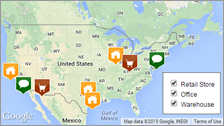
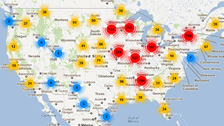
CSV Address Geocoding with Icon Filter and Information Box
View Demo
- Geocoding support - adding locations by using real addresses
- Markers and text box information added by loading external CSV file
- Marker filter to display selected icon type
- Custom marker icons
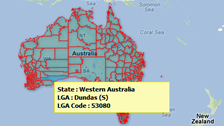
Census Data and Demographics Map
View Demo
- Using shape files of administrative divisions like states or provinces, or statistical regions like census tracts or regions, and overlay them on a base Google Map
- Suitable for sales and business data analysis
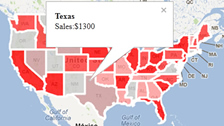
Visualize Business Sales Data in Europe using Heat Maps
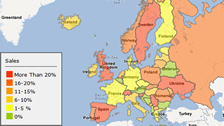
View Demo We have developed choropleth mapping in our online map editor to help creating heat maps. Import data from your data source such as Excel files is possible. Color gradient would be generated to highlight trends and distributions over geographical areas.
Crowdsourcing Map ( Let Users Add Locations to Your Map )
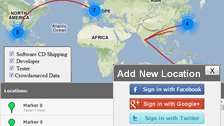
View Demo Enable crowdsource map feature. Let visitors add themselves on your map. Gather information for visual analytic.
Central Paris Map with Scattered Markers
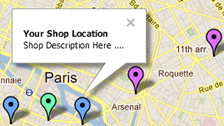
View Demo
- Plotting of map markers according to longitude & latitude values (GPS coordinates)
- Data driven with location and information box content drawn from an uploaded CSV file
- Suitable for visualizing members locations, facilities & branches
Represent Multiple Database Stats on Heat Map/ Choropleth Map
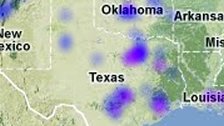
View Demo Heat Maps or Choropleth Maps are a thematic maps for geographical representation of statistics by dots or by areas. Heat Map uses a color progression or gradients to depict data per area. Data source usually come from databases or even Excel files.
Congressional District Map with ZIP Code Search
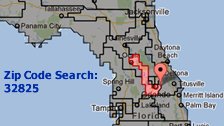
View Demo This demo shows the usage of Geocoding API of Google Maps to decipher the exact location of the ZIP code, and highlight the corresponding congressional district the ZIP code locates. You can enter a ZIP code underneath the map and click "Search" to see the result.
Density Heat Map
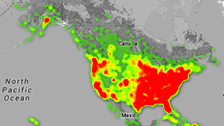
View Demo We can create custom maps to show your locations as density heat maps. The samples below consist of a dataset of over 40,000 points, and the coverage across the world can be easily identified.
Create Geographical Area Polygon Overlay Maps ( States / Counties )
View Demo Apply geographical areas & boundaries overlay on a Google Map. Create administrative division maps, states map or US county maps.
Create Custom Image Map in GMap Editor
View Demo New feature ! Create a custom image map by importing the image and add different overlays, like markers, labels, polylines to the online editor.
Enable Map Category Legend ( Display / Hide Map Overlay Layers )
View Demo New feature ! Apply category legend on your map. Use checkboxes to control ( show / hide ) overlay objects / map layers with categories.
US States Overlay on Google Maps
View Demo Google Maps would show state and province borders, but they are not customizable. By using GIS data, it is possible to create overlays on a Google Map. They can be custom regions, administrative divisions (states, provinces etc.), and even ZIP code/postcode areas.
Create Data Clustering Live Maps ( Data Mining Maps )
View Demo New feature ! Apply markers clustering on a Google Map. Create data clustering live maps or data mining Maps for visualization / presentation of business data.
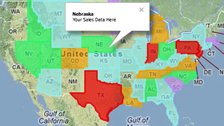
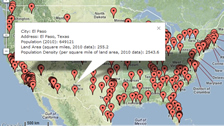
Import Excel Spreadsheet data to generate US Population Map
View Demo
- Import Excel data - copy & paste from Microsoft Excel to the map editor
- Geocoding of locations by specifying the address on each data row
- Data columns are automatically aligned & shown in information box
HTML5 Maps
created by iMap HTML5 mapping software with cross-platform support or through custom map service.
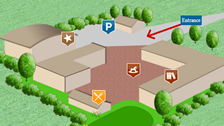
Interactive Floor Plan Maps in Flash/ HTML5

View Demo Create an interactive floor plan as a locator map of exhibitors for trade show. Event organizers can use the system to manage vacancies of venues. Real time floor plans can show the current occupancies, and heat maps can be generated from occupancy data to maximize usage of venues.
5-digit ZIP code map of Pennsylvania with HTML5 and SVG
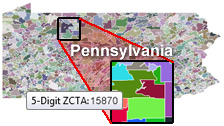
View Demo 5-Digit ZCTA map of Pennsylvania, United States developed with HTML5, for cross-platform cross-device usage.
Flash Maps
created by Flash Map Editor or iMapBuilder for Windows.
Gini Index Map as an Intensity (Heat) Map
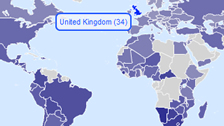
View Demo Showing a heat map of Gini Index and popup box for numbers of country
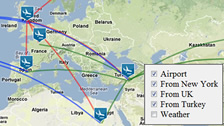
Airline Operations Across the Atlantic
View Demo Interactive flight airlines map with pinpoint location and custom company logo image.