Loading
User Guide > Heat Map
Heat Map in GMap Editor V2
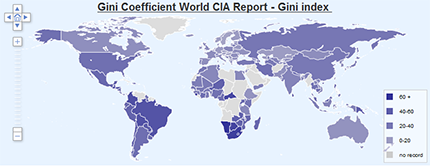
Heat Map is a geographical presentation of data in numerical values by using colors. Such kind of map is heavily utilized to visualize the location-based data by highlighting trends and distributions across a geographic area.
Heat Map can be used to show:
- Density of data (members) per ZIP codes / Population density
- Sales turnover by regions/sales reps area
- Percentage change in traffic accidents and crime rates
- Website visitor pattern around the world (using IP address)
- Relative strength between currencies
- Mobile network signal strength and quality in cities
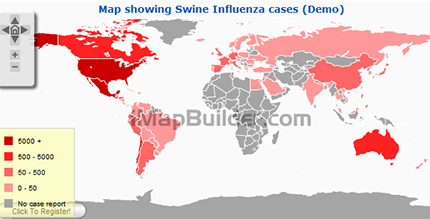
- Pandemic/Disease case info per country for medical and health industry
- Working capacity for each state
- Support levels/voting of different political parties in opinion polls and elections
Steps for Enabling Heat Map
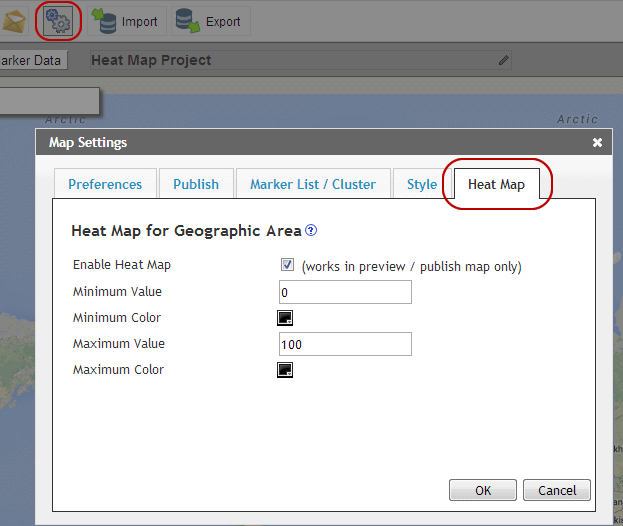
- Select "Map Settings" button in horizontal toolbar
- Select tap of "Heat Map"
- Check the checkbox for enabling heat map
(Heat Map can only be viewed in Preview mode / Published Map) - Set Minimum and Maximum heat map value in boxes
- Select heat map colors for minimum and maximum values respectively in popped up color picker > click "Apply" button
- Click "OK" to apply the settings

Steps for editing heat map value for regions
- Select "Geographic Area Polygons Tool" in vertical toolbar
- Select region for adding heat map value
- Geographic polygons will then be added on the map
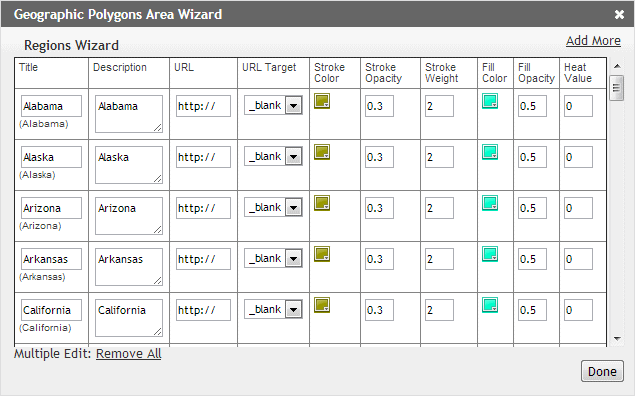
- Click "Geographic Area Polygons Tool" > an editing panel will be popped up
- Edit Heat Map Value in the panel > Click done to apply it
- Click "Add More" if more heat map regions are needed.

GMap Video Tutorial - Create a Heat Map in Custom Google Map
[ Top of Page ]


