User Guide > Map Settings > Markers List & Clustering
Markers List & Clustering in GMap Editor V2
In the GMap Editor, you can add markers list and enable the clustering function in the Map Settings panel. The updated changes will be shown in the Preview Mode, or in the Published Map.
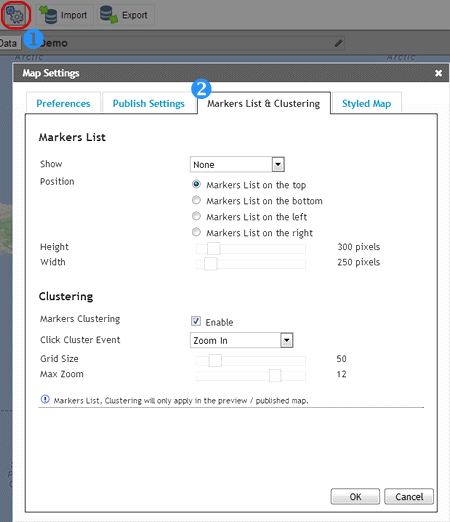
Settings- Markers List & Clustering
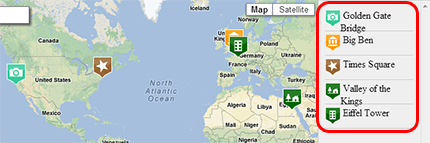
Markers List
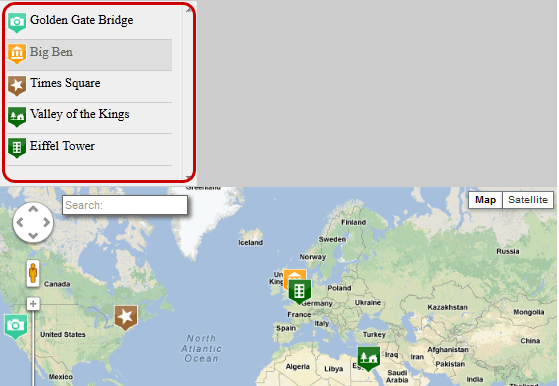
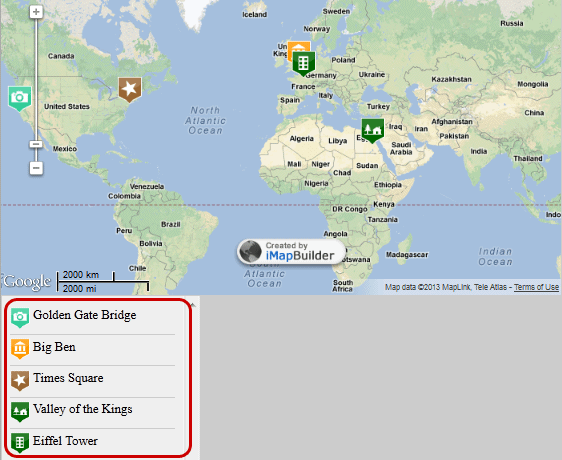
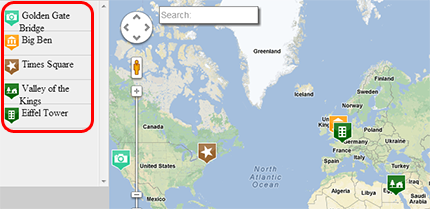
The markers list, which displays markers' icon and title, will be shown along with the published map. You can edit the markers list' s setting in the editing panel.| Items | Descriptions |
| Show |
|
| Position |
|
| Height |
|
| Width |
|
Clustering
Markers Clustering in a Custom Google Map
Clustering is a way to group markers on the map based on factors, such as proximity or map data. It makes the map leaner and cleaner without flooding the map with overlapping markers for large datasets, which is difficult to navigate and distinguish from each other.
Clustering also helps improving the perceived performance of the map. Here are examples of differences between disabling and enabling the markers clustering:
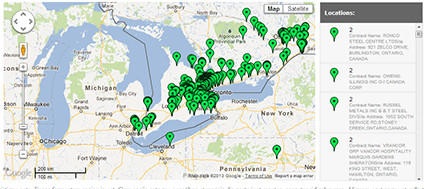
Disable clustering function
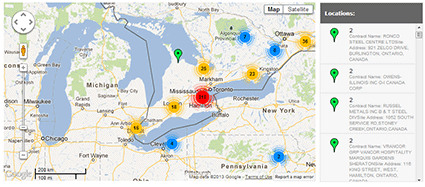
Enable clustering function
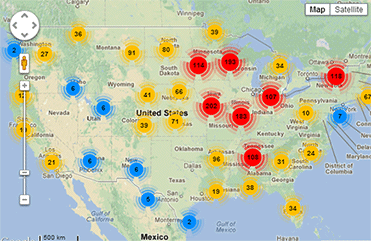
Example - Create a Data Mining Maps that using the Clustering Function
Edit the clustering settings
| Properties | Descriptions |
| Grid Size |
|
| Max Zoom |
|
[ Top of Page ]